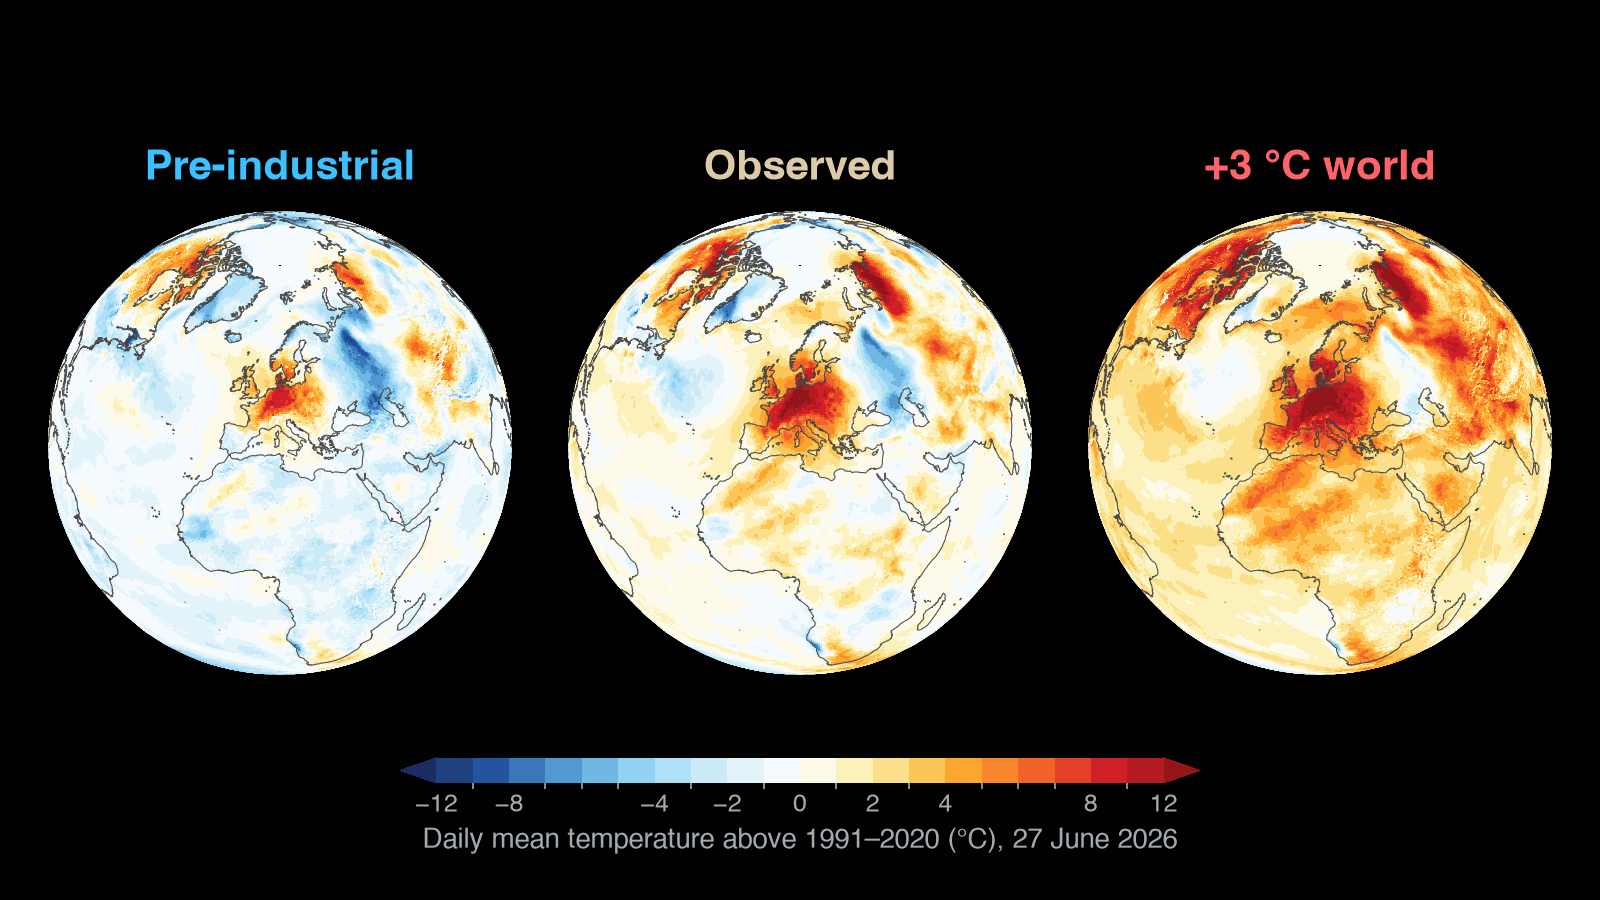
At its peak on 27 June 2026, the heatwave that gripped Europe at the end of June was 7.5 °C above normal over the area it hit hardest. In the climate of pre-industrial times, the same day would have been 3.7 °C cooler. In a world 3 °C warmer than pre-industrial times, it would have been 1.8 °C hotter still.
These numbers come from real time climate storylines, an online app that shows each day's weather across the globe in three climates: pre-industrial, observed, and a world 3 °C warmer. Same day, same weather pattern, three different backgrounds. Pick any date since 1940 and see it in all three.
Europe's June 2026 heatwave in three climates
The heatwave peaked on 27 June over western and central Europe. Over the area it covered, from France to Poland and from the Alps to southern Scandinavia, the daily mean temperature was 7.5 °C above its 1991–2020 normal for the date: a temperature anomaly of +7.5 °C.
- In the pre-industrial climate, the same day would have been 3.9 °C above normal: still a hot day, but 3.7 °C cooler than the one people lived through.
- In a +3 °C world, it would have been 9.4 °C above normal, another 1.8 °C hotter. The five climate models behind that world range from 8.1 °C to 12.0 °C above normal.
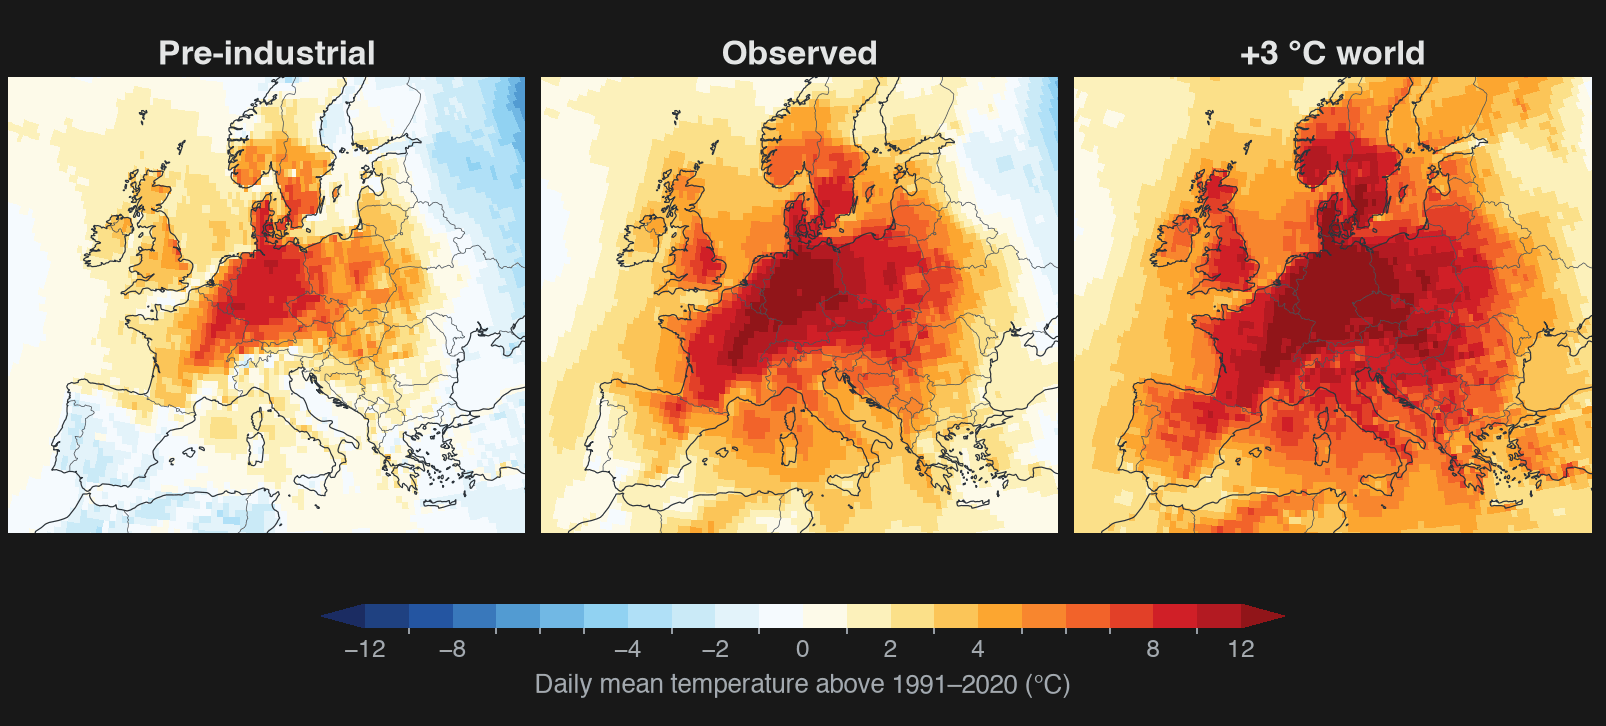
Hover over (or tap) any place to read its temperature in the three climates.
Heatwave area average: pre-industrial +3.9 °C · observed +7.5 °C · +3 °C world +9.4 °C
Pre-industrial

Observed

+3 °C world

Figure 1. The June 2026 heatwave in Europe on its peak day, 27 June, in three climates: daily mean temperature above the 1991–2020 normal. The figures in the text are averages over the area where the observed day was more than 8 °C above normal (43–59°N, 1°W–25°E). The +3 °C world is the mean of five climate models.
Source: the climate data factory, real time climate storylines, built on ERA5 (Copernicus Climate Change Service, ECMWF).
What attribution scientists found
World Weather Attribution studied the same heatwave while it was happening (Keeping et al., 2026). Over the same part of Europe, they found its three hottest days were about 3.5 °C hotter by day and 2.4 °C hotter at night than they would have been in the climate of 1976. Our storylines give a consistent picture: 3.7 °C for the daily mean against pre-industrial times.
The difference is in what comes with that number. An attribution study answers one question about one event, for one region. The storylines give the whole map of every day since 1940, in three climates, updated as the weather record is: any heatwave, anywhere, within days of it happening, and how it would play out in a +3 °C world. And because they are complete weather maps, they can be fed straight into impact models.
Global temperature anomaly since 1940
Single days vary a lot, so the global picture is clearer over whole years. The three climates run side by side from 1940: the observed world starts close to the pre-industrial one and climbs away from it, while the +3 °C world stays about 3 °C above the pre-industrial reference throughout.
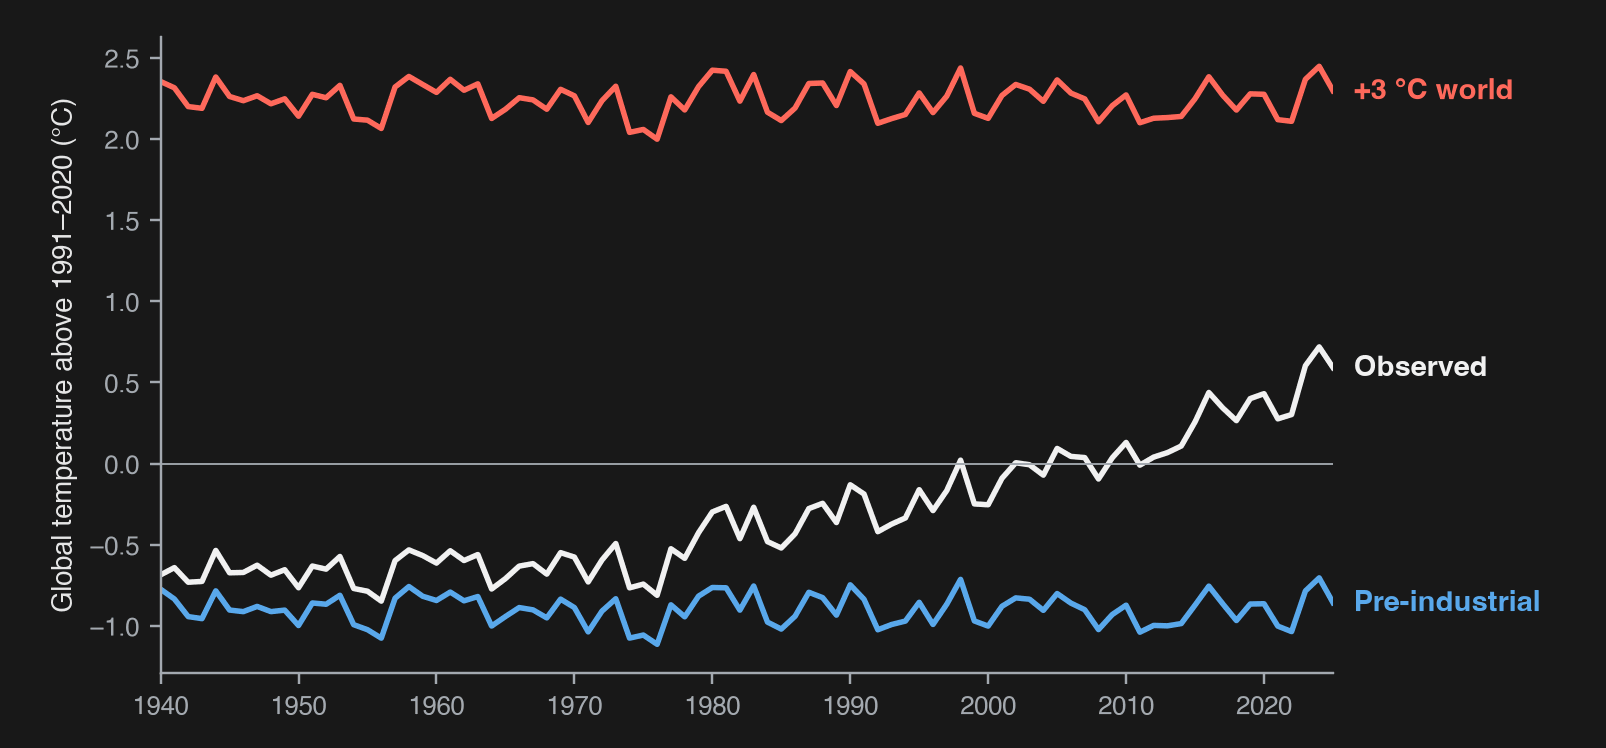
Hover over (or tap) the chart to read a year's values.
Figure 2. Global temperature anomaly in the three climates: yearly global mean surface air temperature, 1940–2025, above the 1991–2020 average.
Source: the climate data factory, real time climate storylines, built on ERA5 (Copernicus Climate Change Service, ECMWF).
How warm is the world today? The global temperature averaged 1.26 °C above the 1850–1900 pre-industrial level over 2016–2025, and the human-caused part of the warming reached 1.37 °C in 2025 (Forster et al., 2026). For what a warming level such as +1.5 °C or +3 °C means, and why a single hot year does not mean a level has been reached, see our glossary entry on global warming levels.
Why alternative versions of the weather are worth having
They are not just a nicer way to say "climate change made the heatwave hotter".
- Impact models can be run twice. Feed the real weather and its alternative version into the same crop, water, energy or heat-stress model, and the difference is the impact of warming: yields, river flows, peak demand, exposure. Not degrees, consequences.
- They are complete maps, not a single headline number. The whole globe, at the same detail as the original weather record, so impact models can use them straight away.
- They are continuous. Decades of them, all built the same way, so heatwaves can be compared with each other instead of needing a separate study for each one.
- They run both ways. A cooler past and warmer futures: what an event would have been without us, and what the same event looks like at +3 °C.
- They are fast. They update as the weather record updates, so the alternative version of an event exists while the event is still in the news.
How it works
We do not re-run a climate model for every event. That is expensive, and it has to be done one event at a time. Instead we start from ERA5, Europe's record of what the weather actually did, everywhere on Earth, day after day since 1940, produced by ECMWF for the Copernicus Climate Change Service. We then shift that record statistically onto a different climate: the weather pattern stays where it was, only the background climate it sits in changes. That is cheap enough to run every day, and to run backwards across decades.
The pre-industrial version is best read as a fixed reference: the same weather in the climate of 1850–1900. It answers one specific question, how much bigger or smaller an event becomes in a different climate, and is meant to sit alongside established attribution methods, not replace them. The method paper is under review.
See your own heatwave
Pick a day you actually lived through: this summer's heatwave, your birthday, any date back to 1940, and see it in all three climates on real time climate storylines. More weather variables and warming levels will be added. For the data behind it, or for storylines of your own region and variables, contact us.
References
- Forster, P. M., et al. (2026). Indicators of Global Climate Change 2025: annual update of key indicators of the state of the climate system and human influence. Earth System Science Data, 18, 3889. https://doi.org/10.5194/essd-18-3889-2026
- Keeping, T., Barnes, C., Clarke, B., Bergin, C., Pinto, I., et al. (2026). Fossil fuel emissions have rapidly worsened European heatwaves in just a few decades. World Weather Attribution scientific report, Imperial College London. https://doi.org/10.25560/130926
- Hersbach, H., et al. (2020). The ERA5 global reanalysis. Quarterly Journal of the Royal Meteorological Society, 146, 1999–2049. https://doi.org/10.1002/qj.3803