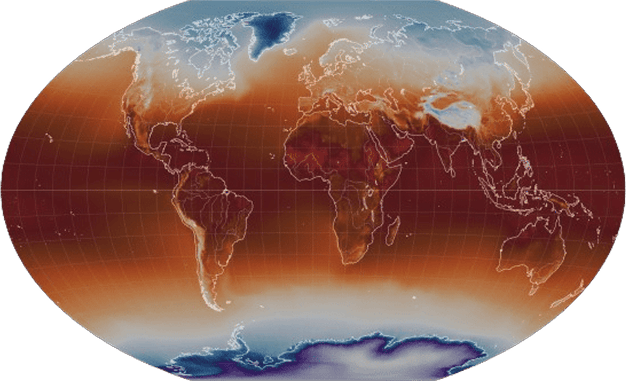
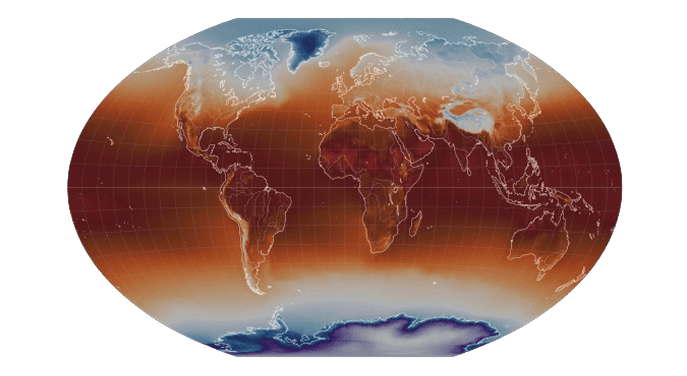
Climate projections of hazards and weather variables
Our climate projections data are suitable for direct use in climate change impact studies and physical risk assessments. Our referenced high-resolution, multi-model, and multi-scenarios climate projections of weather hazard and variables, is the most coherent collection of climate information available for risk analysis and modeling.

Climate projections features
The climate simulation data have a variety of specifications among which spatial resolution, climate models, future scenarios, temporal resolution and data formats.
High-resolution
A spatial resolution of 0.10°x0.10° (about 10x10 km) over the globe. Temporal resolution is annual for the hazards indicators, daily for the variables, and covers the period from 1981 to 2100.
Multi-scenario
Three Shared Socioeconomic Pathways from IPCC AR6 (SSP1-2.6, SSP2-4.5 and SSP5-8.5) based on the CMIP6 experiment. Other scenarios available on demand. Global Warming levels are also available.
Multi-model
The five reference Earth System Models from IPCC AR6 selected by the Inter-Sectoral Impact Model Intercomparison Project (ISIMIP). More models are added progressively.
Global Warming Levels
Global Warming Levels (GWLs) show how much global temps have risen above pre-industrial conditions (e.g., 1.5°C, 2°C, 3°C, and 4°C). Hazard data can be delivered accordingly.
Custom periods
Hazard annual data can be delivered as is or averaged over 20-years or 30-years periods according to your specifications.
Multiple formats
Data files are netcdf, a commonly used format for climate model data, but depending of the volume of data other formats are possible such as geotifs, shapefiles, and others.
Climate projections of hazards
Lorem ipsum dolor sit amet, consectetur adipiscing elit. Quisque et magna leo. Quisque non urna odio. Duis rhoncus quam eget purus efficitur, ac aliquet sapien pellentesque.

Wildfires
Wildfire hazard indicators based on the Canadian Fire Weather System: Fire Weather Index, Extreme Danger Days and Fire Season Length.
read more
Landslides
Landslide hazard indicators based on NASA’s Landslide Hazard Assessment for Situational Awareness (LHASA) model: Nowcast days for very high, high, and medium risk.
read more
Storms
Storms hazard indicators based on daily maximum surface wind speed: Storm Severity index (SSI) based on scaled exceedance and extreme wind days.
read moreHeat waves
Heat waves hazard indicators based on daily maximum and minimum surface temperature: heat wave duration index and periods, consecutive summer days and periods, very warm days and nights.
read moreCold and frost waves
Cold and frost waves hazard indicators based on daily maximum and minimum surface temperature: cold wave duration index and duration, consecutive frost days index and periods, very cold days and nights.
read moreDroughts
Meteorological drought hazard indicators based on daily total precipitation: dry days Index, consecutive dry days index, number of consecutive dry days periods.
read moreHeavy precipitation
Heavy precipitation hazard indicators based on daily total precipitation: very heavy precipitation days, very wet days, precipitation fraction due to very wet days, and highest five-days precipitation amount.
read moreFloods
Pluvial flood hazard indicators based on daily total precipitation: maximum consecutive five-days precipitation, extreme precipitation total, frequency of extreme precipitation.
read moreTemperature variability and change
Temperature statistics indicators based on daily mean, maximum and minimum surface temperature: monthly daily mean/max/min temperature and daily temperature range by calendar month.
read morePrecipitation variability and change
Total precipitation statistics indicators based on daily total precipitation: monthly total precipitation by calendar months, rainy days, rainy days, consecutive rainy days, consecutive rainy periods.
read moreWater stress
Evapotranspiration indicators according to several formulas.
Coming soon
Soil erosion
Rainfall induced soil erosion.
Coming soon
Tropical Storms
Return periods and levels due to tropical storms (cyclones, hurricanes and typhoons).
Coming soon
Climate projections of weather variables
Lorem ipsum dolor sit amet, consectetur adipiscing elit. Quisque et magna leo. Quisque non urna odio. Duis rhoncus quam eget purus efficitur, ac aliquet sapien pellentesque.
Weather variables from IPCC AR6 (CMIP6)
A global dataset at 0.1° degrees resolution of 9 essential surface variables (temperature mean/max/min, total precipitation, wind speed mean/max, and relative humidity min/max) from 5 climate models under 3 SSP scenarios (SSP1-2.6, SSP2-4.5 and SSP5-8.5).
read moreWeather variables from IPCC AR5 (CMIP5) - Legagy
A global dataset at 0.25° degrees resolution of 6 essential surface variables (temperature mean/max/min, total precipitation, wind speed and solar radiation) from 21 climate models under 2 scenarios (RCP4.5 and RCP8.5).
read moreEnquire Now
Get in touch with our friendly professional team to discuss your climate data challenges and goals and discover how our data and services can support your activities.
Climate interactive map
Explore variables and hazards from high-resolution climate projections data in an animated interactive map.
CLIMATE INTERACTIVE MAP