We are preparing a high-resolution (0.1° x 0.1°, about 10×10 km) Landslide Risk Index dataset and have now completed the projection of the 5 climate models for emission scenario Shared Socioeconomic Pathway 5-8.5 (SSP5-8.5). Two other SSPs (SSP1-2.6 and SSP2-4.5) are underway. The full dataset will be available late 2022 to be used in forward looking physical risks assessments under climate change.
Update: the data is now available, check Ready-to-use climate projections.
What is the Landslide Risk Index?
The Landslide Risk Index (LRI) is a risk category based index used by NASA to operationally provide near-real-time evaluation of potential rainfall triggered landslide hazard events through landslide “nowcasts” (see gpm.nasa.gov/applications/landslides).
How is it calculated?
The method is based on NASA’s Landslide Hazard Assessment for Situational Awareness (LHASA) model that was adapted here for long term climate change application. The main difference with the original approach is a coarser resolution compatible with the use of reanalysis and high-resolution climate model precipitation estimates (about 10×10 km) compared to the high-resolution satellite precipitation evaluations (1×1 km) .
The LHASA model is used to provide near-real-time evaluation of potential rainfall triggered landslide hazard through landslide “nowcasts”. The LHASA model is based on the combination of a landslide susceptibility map and a precipitation index evaluated from NASA precipitation estimates. The susceptibility map provides a relative evaluation of static susceptibility calculated from global estimates of slope, lithology, forest cover change, distance to fault zones and distance to road networks. The susceptibility is then divided into 5 categories (very low, low, moderate, high, very high), based on decreasing area of the world occupied by each increasing class, so that each category is twice as large as the next highest. The susceptibility map is available on-line at gpm.nasa.gov/applications/landslides.
In the LHASA model the potential triggering of a landslide event is characterized by a precipitation index called the Antecedent Rainfall index (ARI). The ARI is the weighted accumulation from the last 7 days of rainfall with an exponential weighting. The exponent value was calculated based on calibration at the locations of 949 landslides from the years 2007–2013. The ARI index is calculated at each pixel of the susceptibility map from satellite rainfall estimations and the triggering occurs when the ARI value is above a 95th percentile threshold calculated over a reference period.
For more check the NASA Landslide Team Projects page.
Which weather data do you use to calculate the historical values of the Index?
Landslide risk values for present climate (1991-2020) are calculated using precipitation data from the ERA5-Land reanalysis. A reanalysis is produced by combining weather models with observations to provide a comprehensive description of recent global climate. The ERA5-Land dataset is provided by the Copernicus Climate Change Services (C3S) and is a world reference for historical climate analysis.
Which weather data do you use to calculate future values of the index?
Landslide risk values for future climate (2021-2100) are calculated using data from our high-resolution climate projections. Those are obtained by statistical techniques called “downscaling” that combine reanalysis data and climate model simulations to increase the spatial resolution of the original climate model data (from hundreds of kilometers to tens of kilometers).
Our high resolution climate simulations are based on the ones supporting the recently published 6th Assessment Report of the Intergovernmental Panel on Climate Change (IPCC). We recently produced a high-resolution CMIP6 climate projections dataset that is coherent with the ERA5-Land reanalysis. This allows to have future values of Landslide risk that are coherent with the historical Landslide risk series. For more details on our high resolution CMIP6 dataset please see our data paper: Extending the global high-resolution downscaled projections dataset to include CMIP6 projections at increased resolution coherent with the ERA5-Land reanalysis.
You might be interested our Fire Weather Index projections at high-resolution for wildfire risk evaluation.
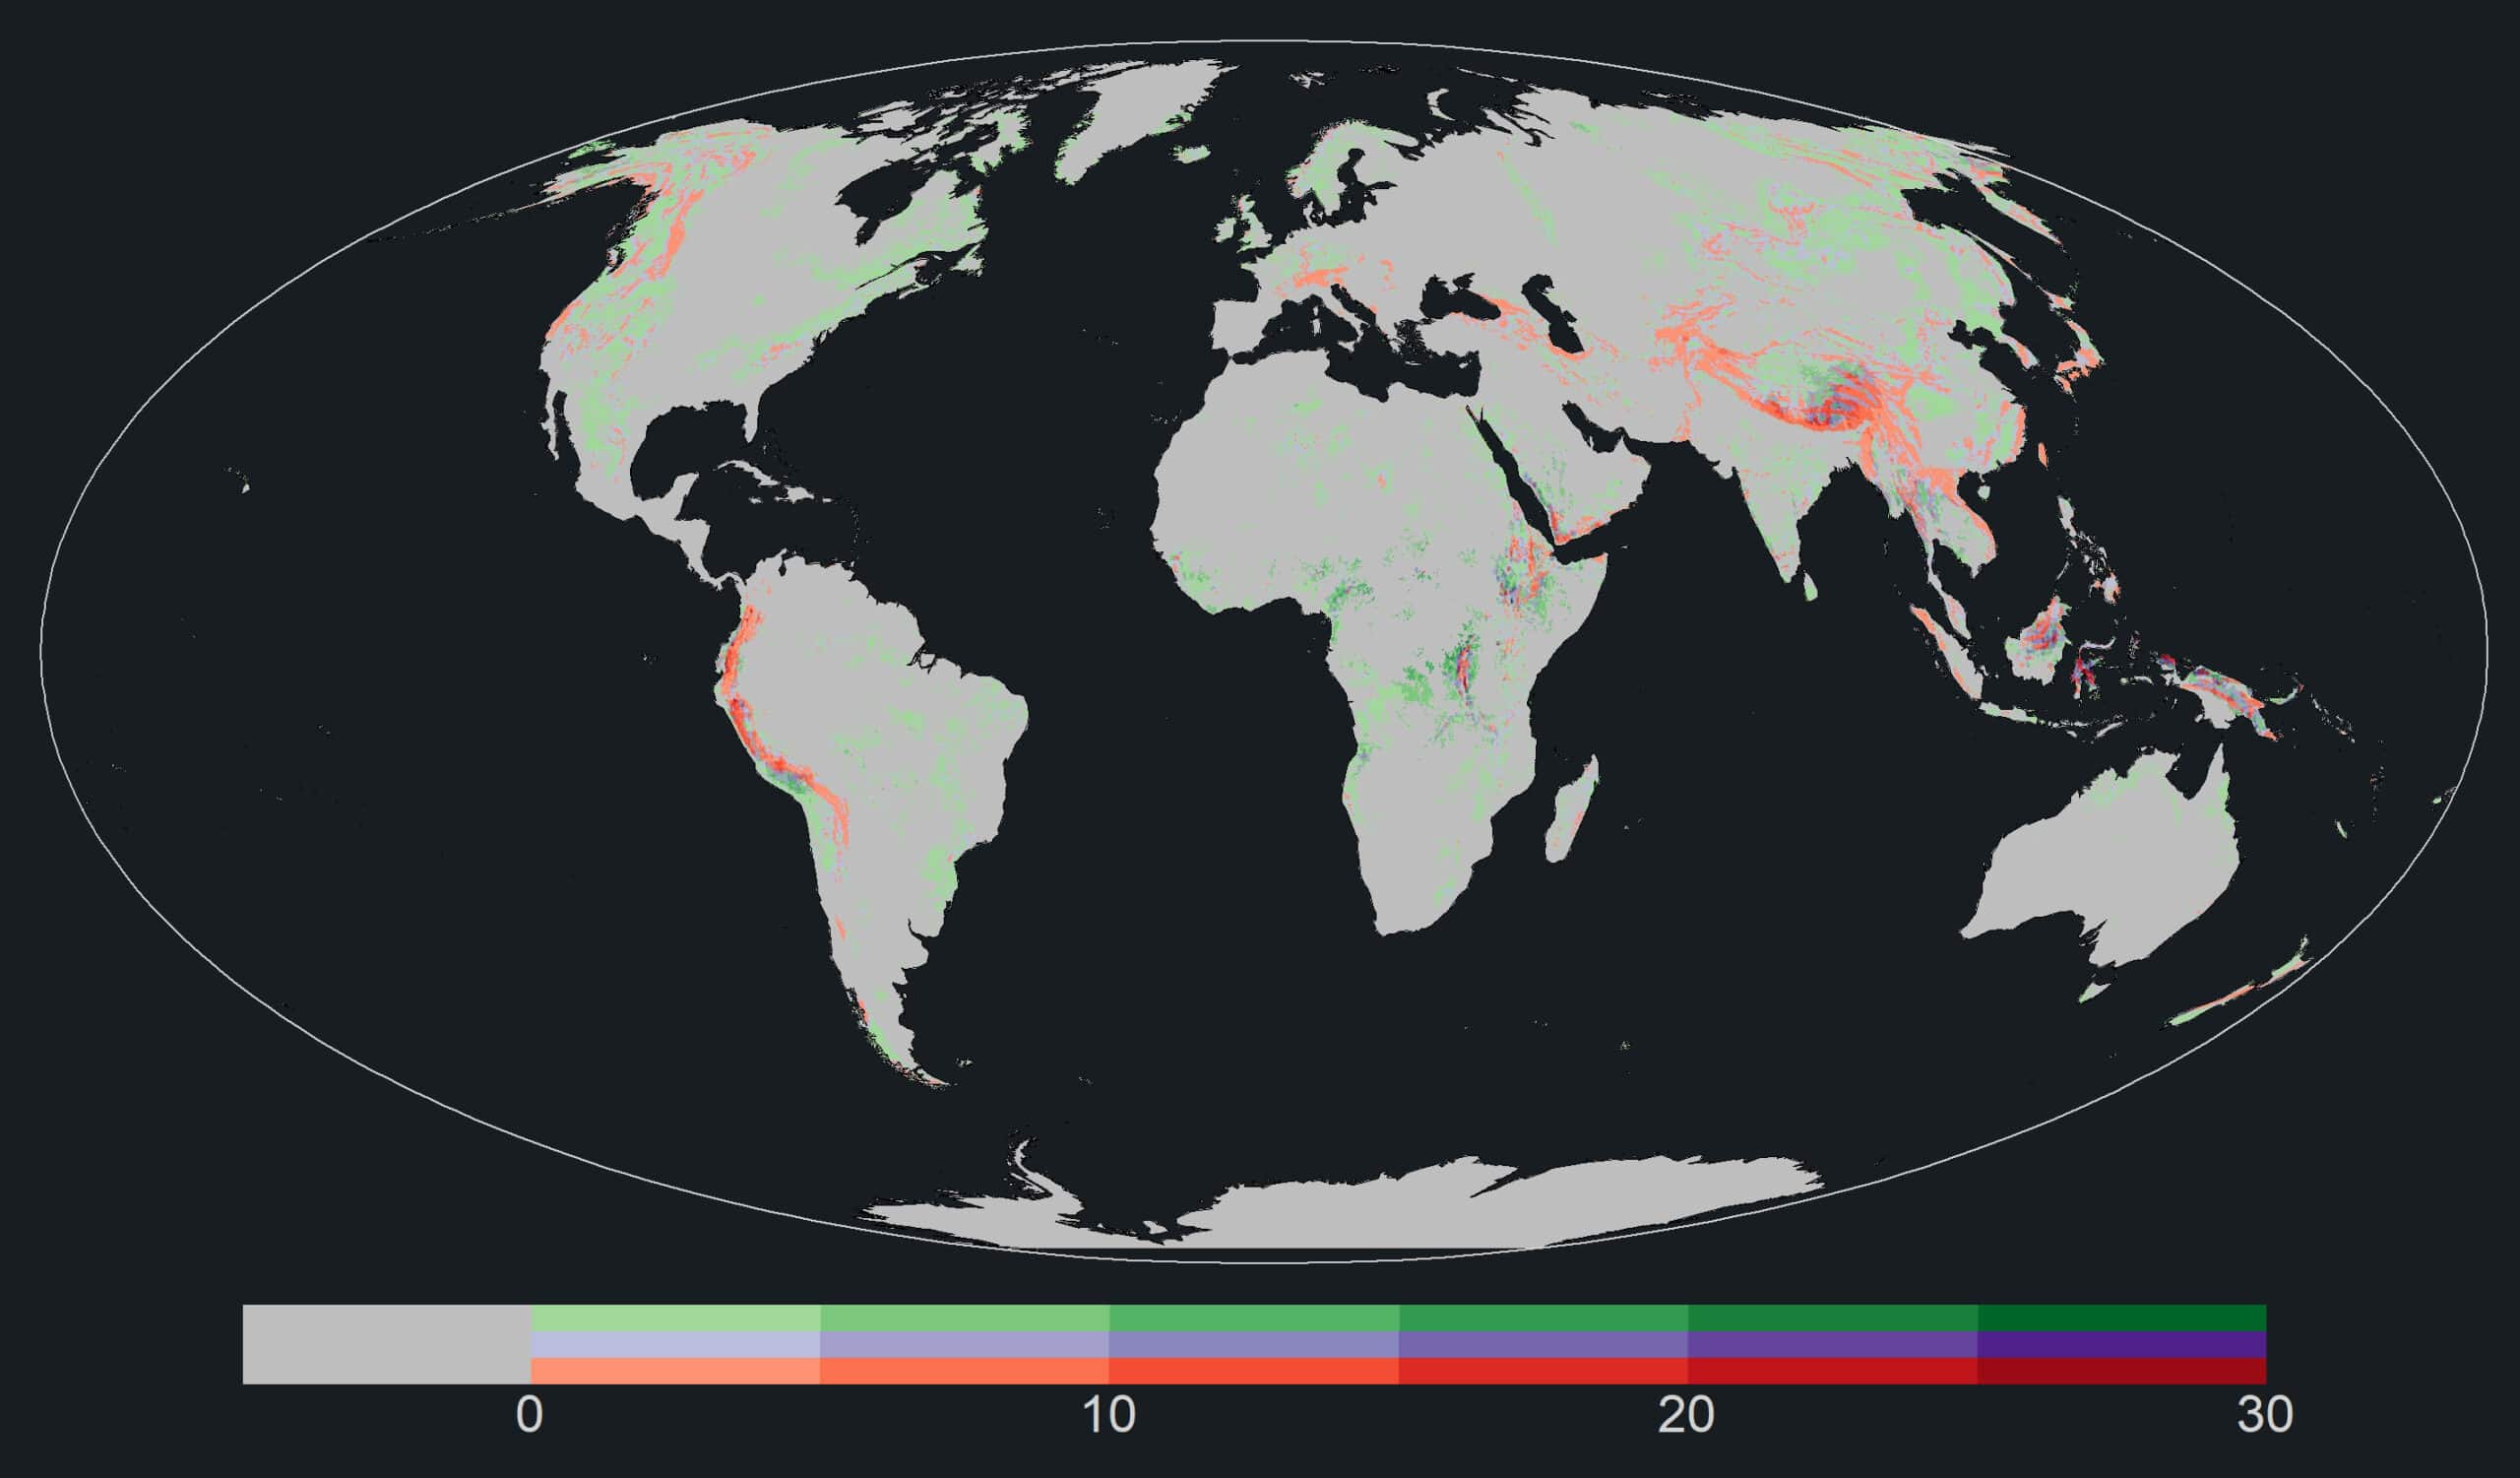
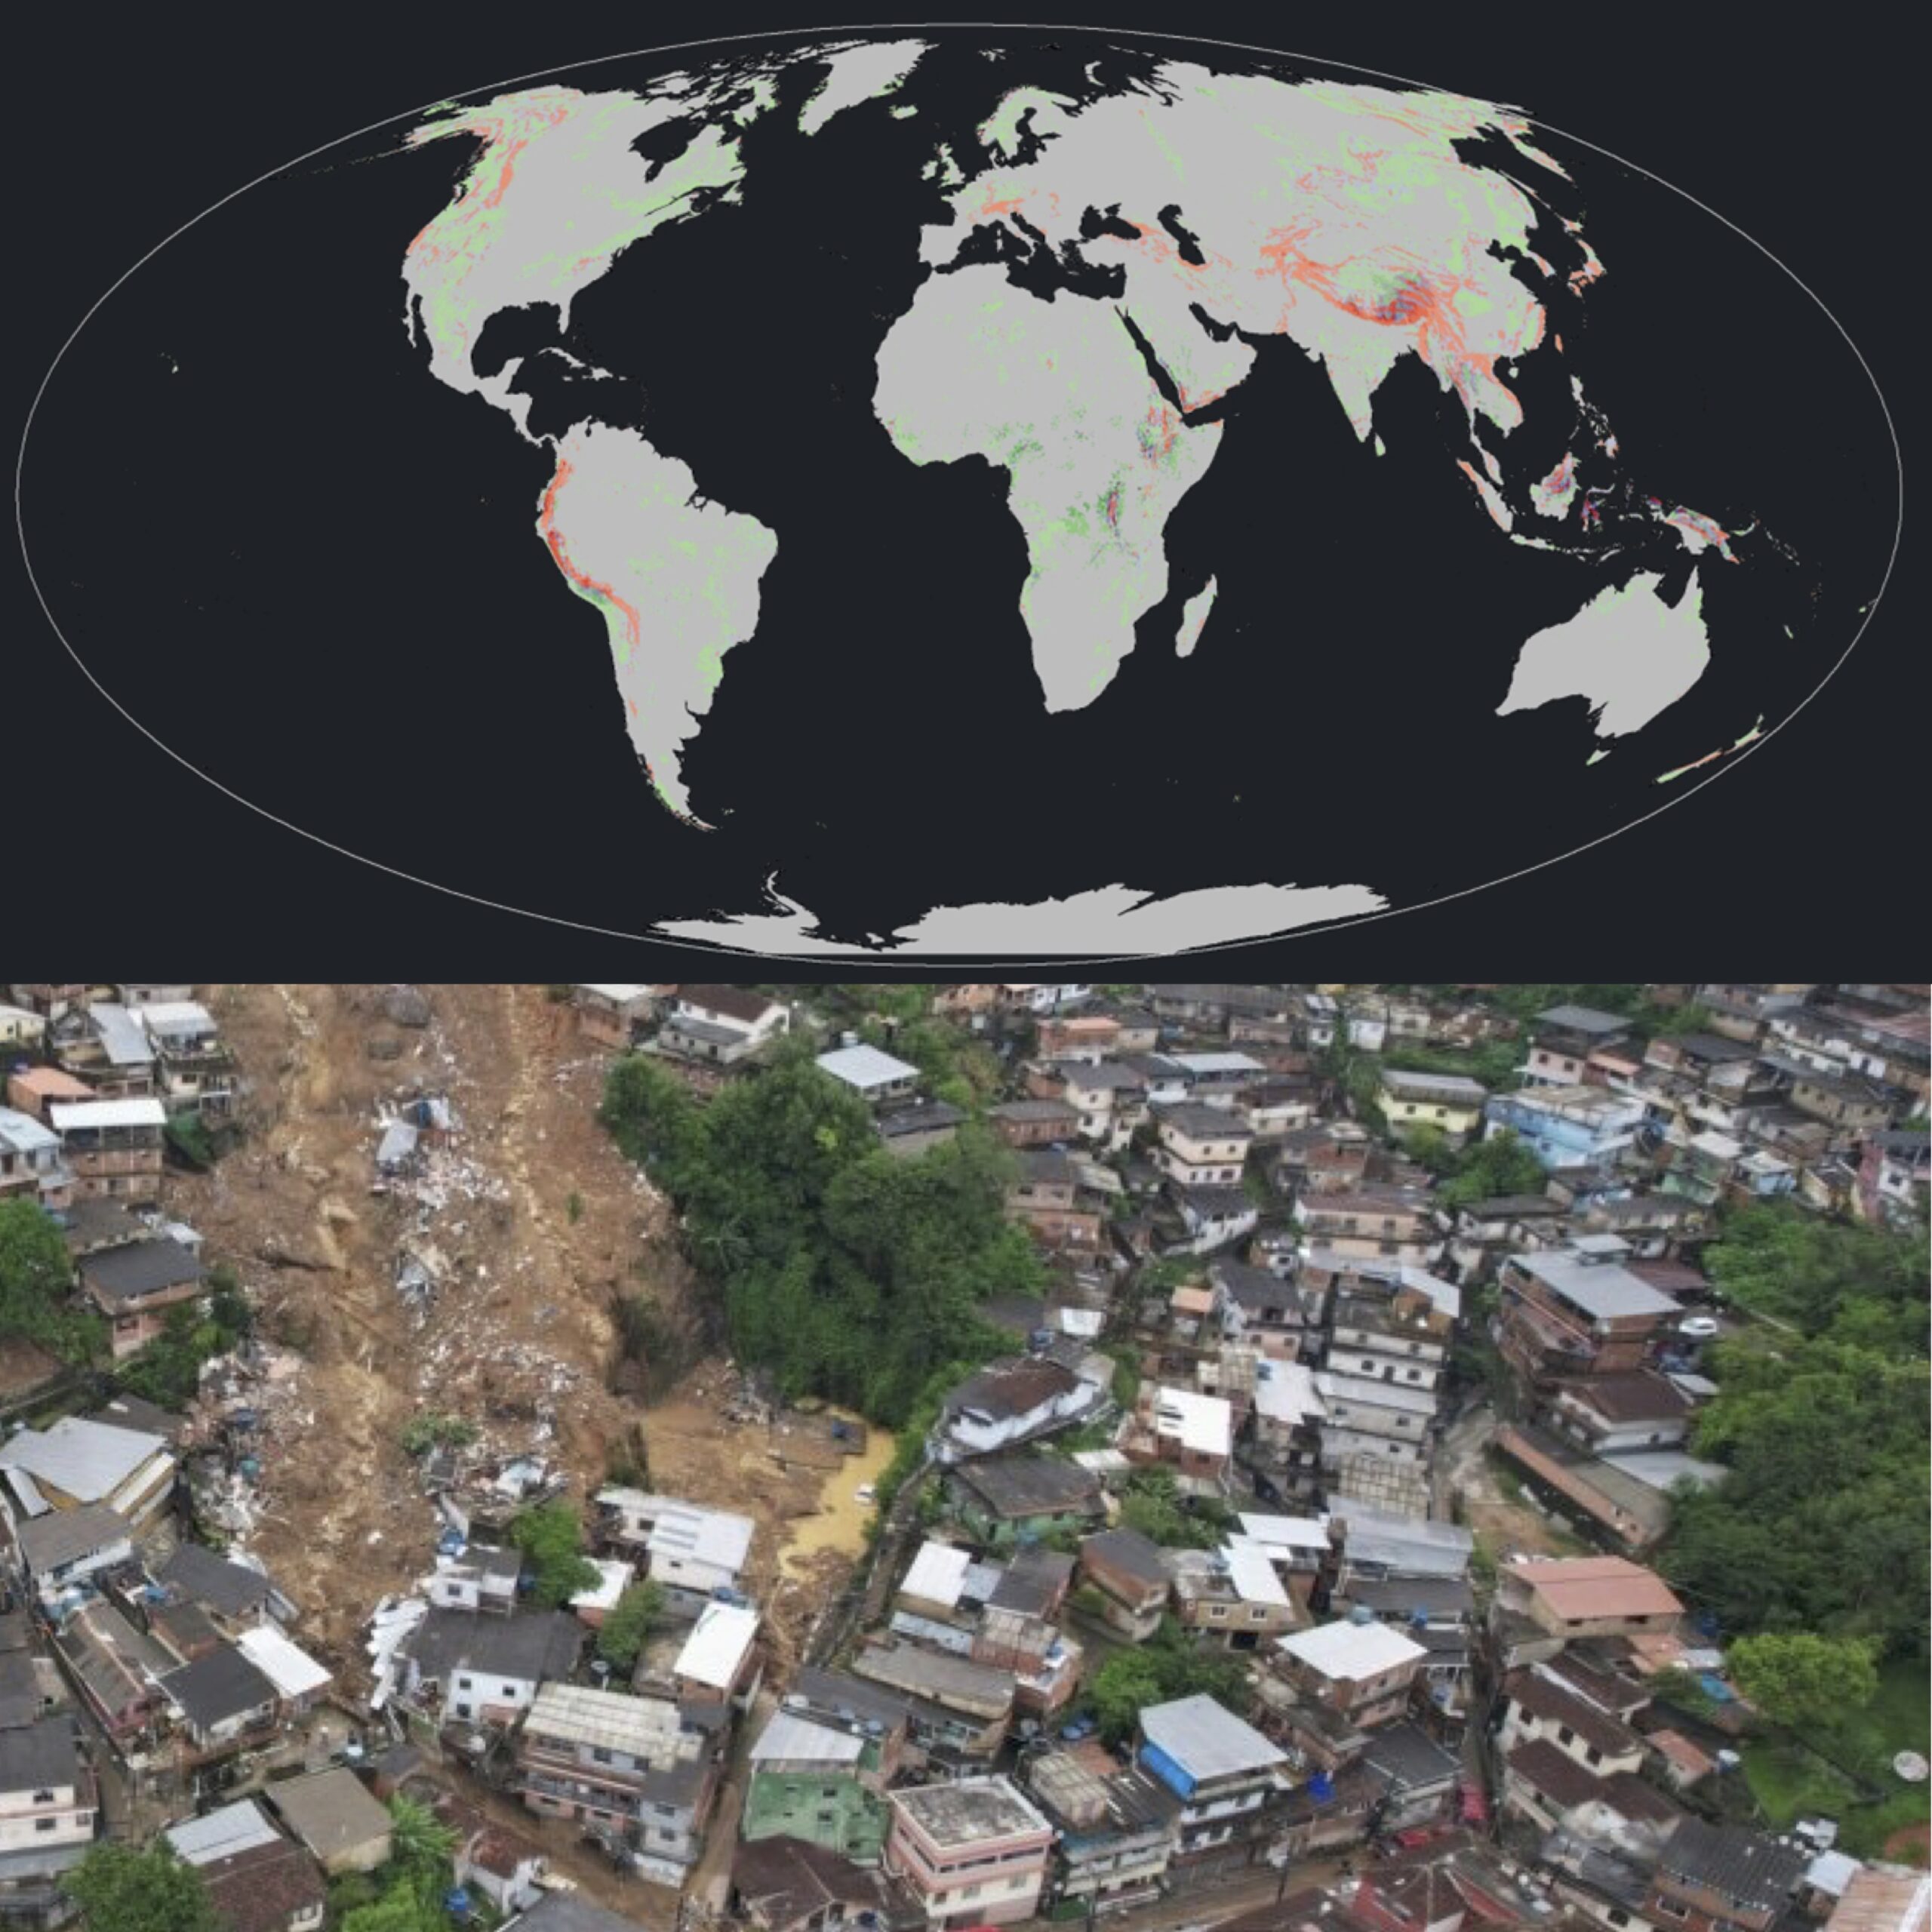
Figure. Future Landslide risk. 30 year average of the LWI Nowcast density (number of days) for Moderate (green scale), High purple scale) and Very High (red scale) risk zones, at the end of the century (2071-2100) for one climate model under Shared Socioeconomic Pathway 5-8.5 (SSP5-8.5).